


.svg)


Go back
Free Multi Timeframe Support and Resistance Guide
August 6, 2023
This script will show you multi timeframe support and resistance levels to make it easier for you to spot the key levels. It works on every pair and of course each timeframe. Supports and resistances are often called “key levels”. They are price levels at which the stock price has inverted its trend. If the price rises and then inverts its trend moving down, the highest point it has reached is called resistance. If the price has gone down and then starts rising, the lowest price value is called support.
Setting up Free Support and Resistance Indicator
Once you have loaded the indicator on the chart, you will see the following things:
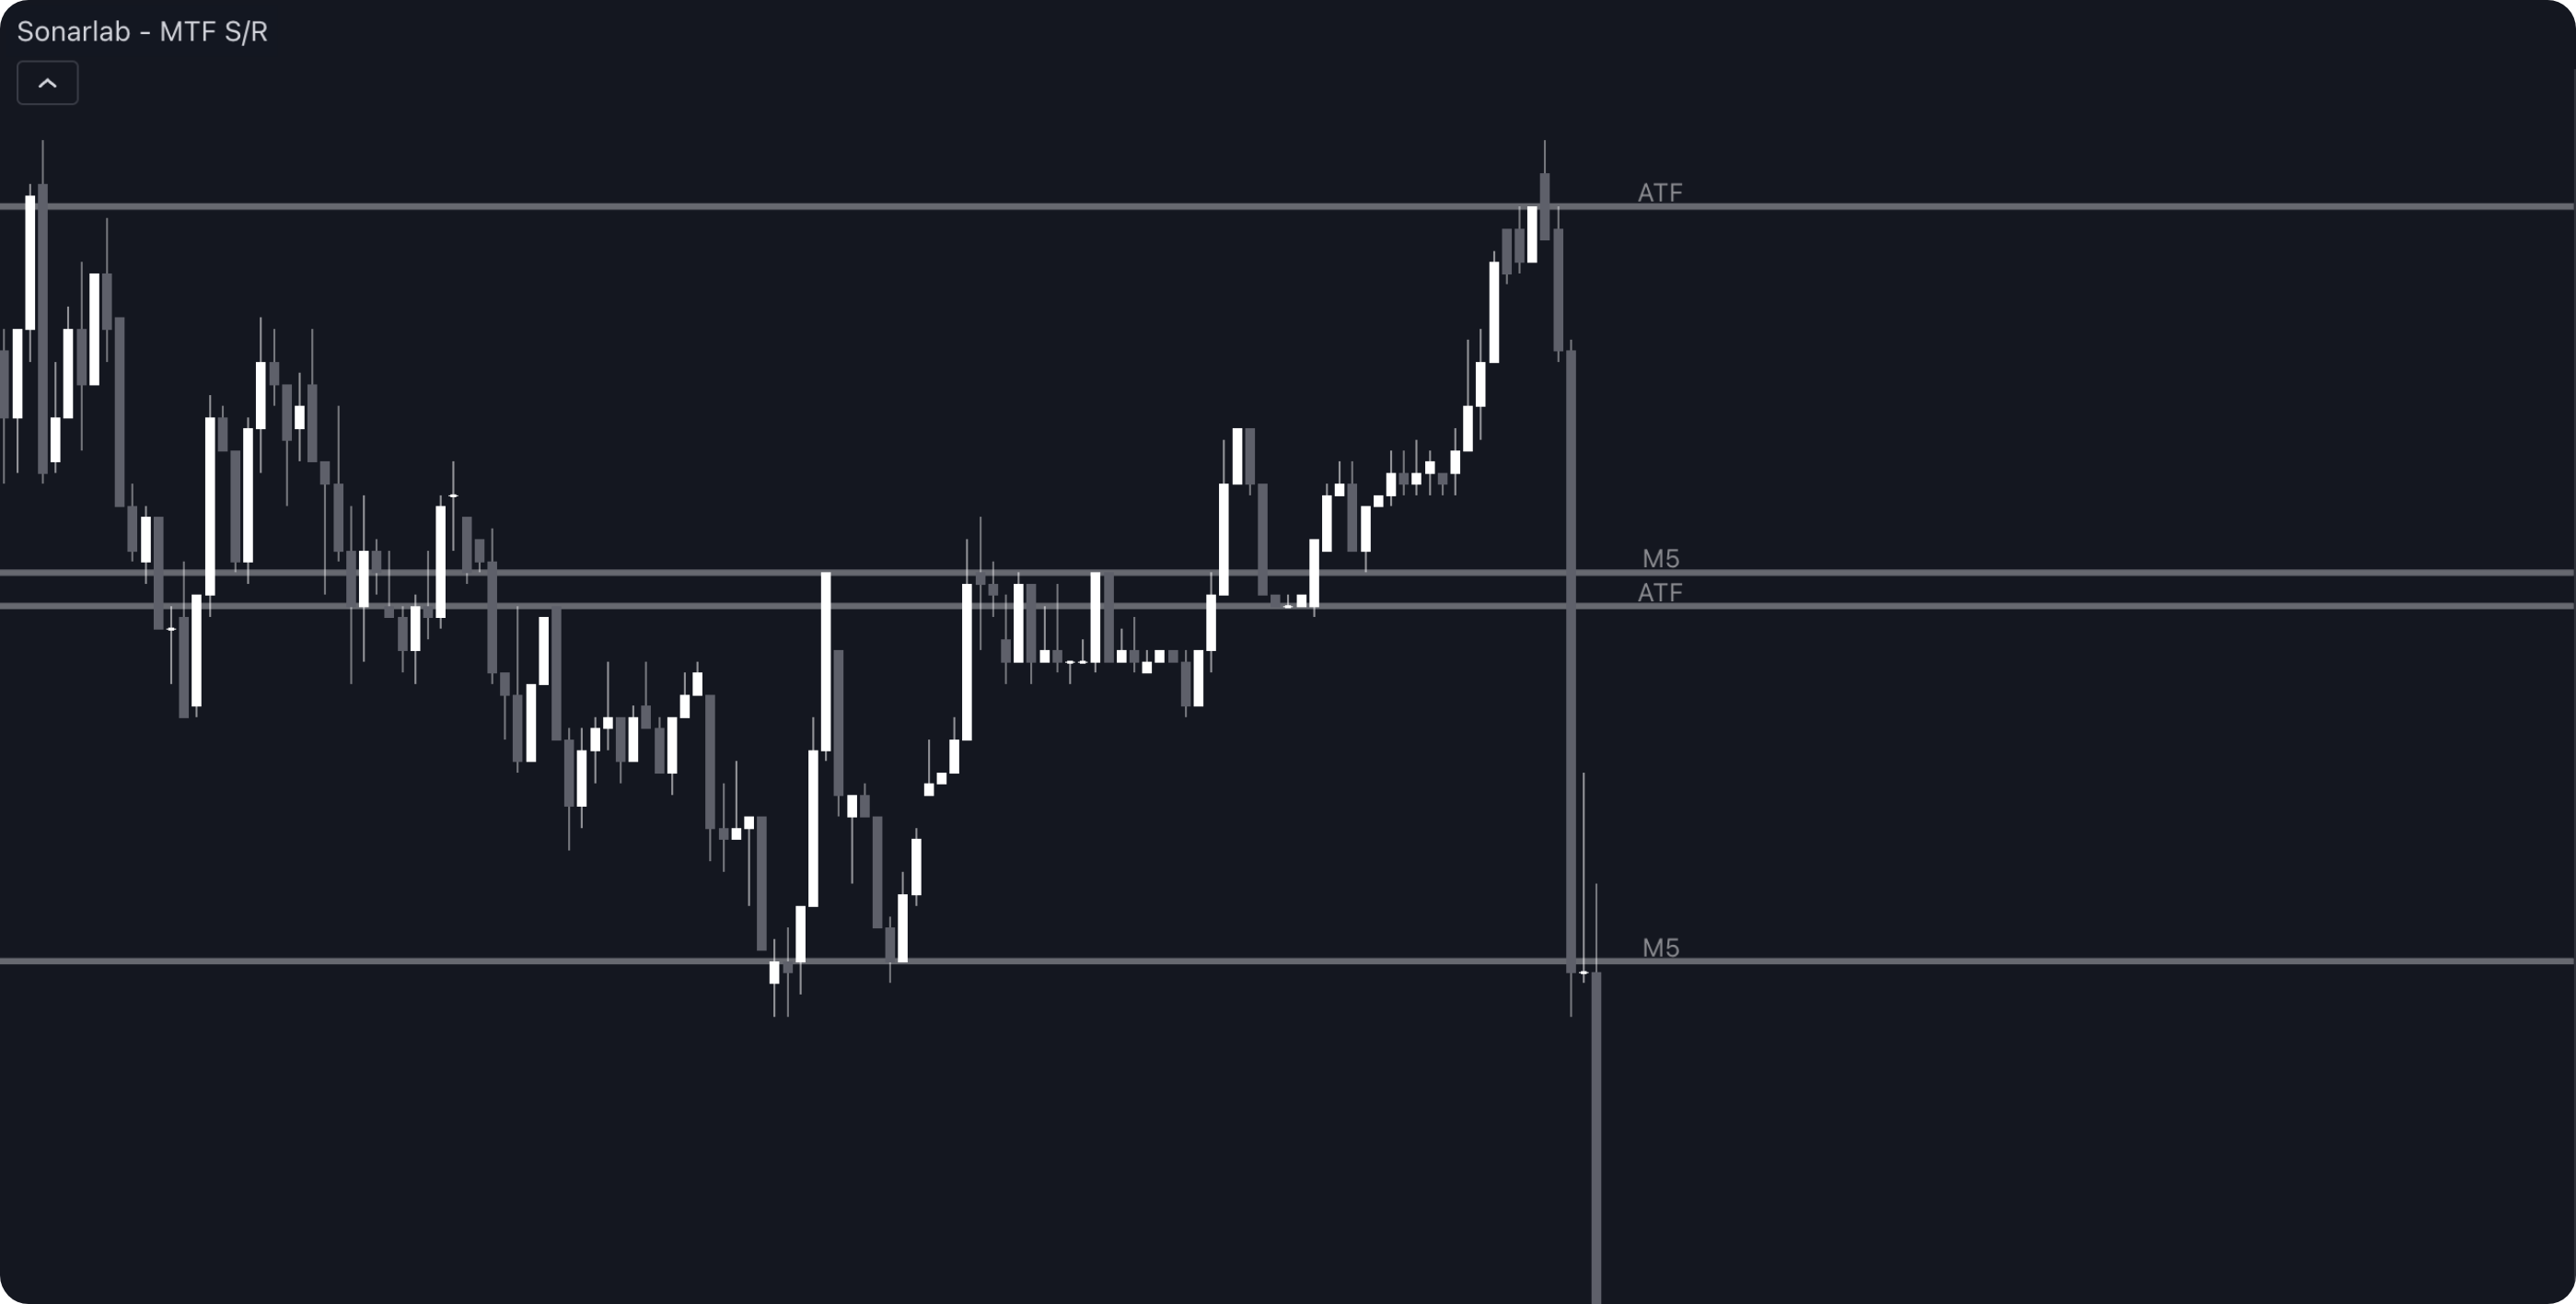
Your trading indicator is designed to mark various Support and Resistance Levels automatically. By default, all these levels are enabled, meaning the system will plot these key points on your chart without any additional input from you. This indicator is also Multi Timeframe, which means it is capable of showing Support and Resistance Levels across multiple timeframes simultaneously. Each level is associated with a specific timeframe, represented by shorthand notations such as '5M' for 5-minute, '15M' for 15-minute, and so on. This feature allows you to get a more comprehensive view of the market, providing insights into price behavior across multiple periods.
The 'Active Timeframe' (ATF) refers to the current timeframe that you're working with on your chart. The ATF is highlighted or displayed differently from the other timeframes, helping you quickly distinguish it from the rest. This is useful because the trading decisions you make often depend on the timeframe you're actively analyzing or trading on.
Settings and parameters
Left Bars
This setting determines how far back in the historical price data the indicator will look to identify support and resistance levels. A higher number of left bars means that the indicator is taking into account a greater amount of past data to establish these levels. This can make the support and resistance levels more robust, as they're based on a larger sample of data, but it might also include levels that are no longer relevant to the current market situation.
Right Bars
This setting indicates how many future bars the support and resistance lines will extend to the right. The higher the number of right bars, the further these lines will stretch into the future, providing a visual representation of where these levels might come into play for future price action.
Line Width
The thickness of the Support and Resistance lines in your trading setup can be adjusted to represent their significance or strength. The scale for this setting ranges from 1 to 5.
1 (Less Thick Lines): A thickness level of 1 represents the thinnest lines on the scale. This typically signifies less significant or weaker support or resistance levels. These levels might have less influence on price behavior, but they can still be valuable in some trading strategies or under certain market conditions.
5 (Thick Lines): On the other hand, a thickness level of 5 represents the thickest lines. These are used to mark the most significant or strongest support or resistance levels. These levels are typically areas where considerable price interactions have occurred in the past, indicating that they could significantly influence future price movements.
S/R Timeframes
Current Timeframe/ Daily/ 4 Hour/ 1 Hour/ 30 Minute/ 15 Minute/ 5 Minute
Alerts
The Liquidity Finder comes with 4 alerts: New High/Low printed, New HTF High/ Low, which are easy to set up. You can read the documentation here.
How to enable the Free Indicator?
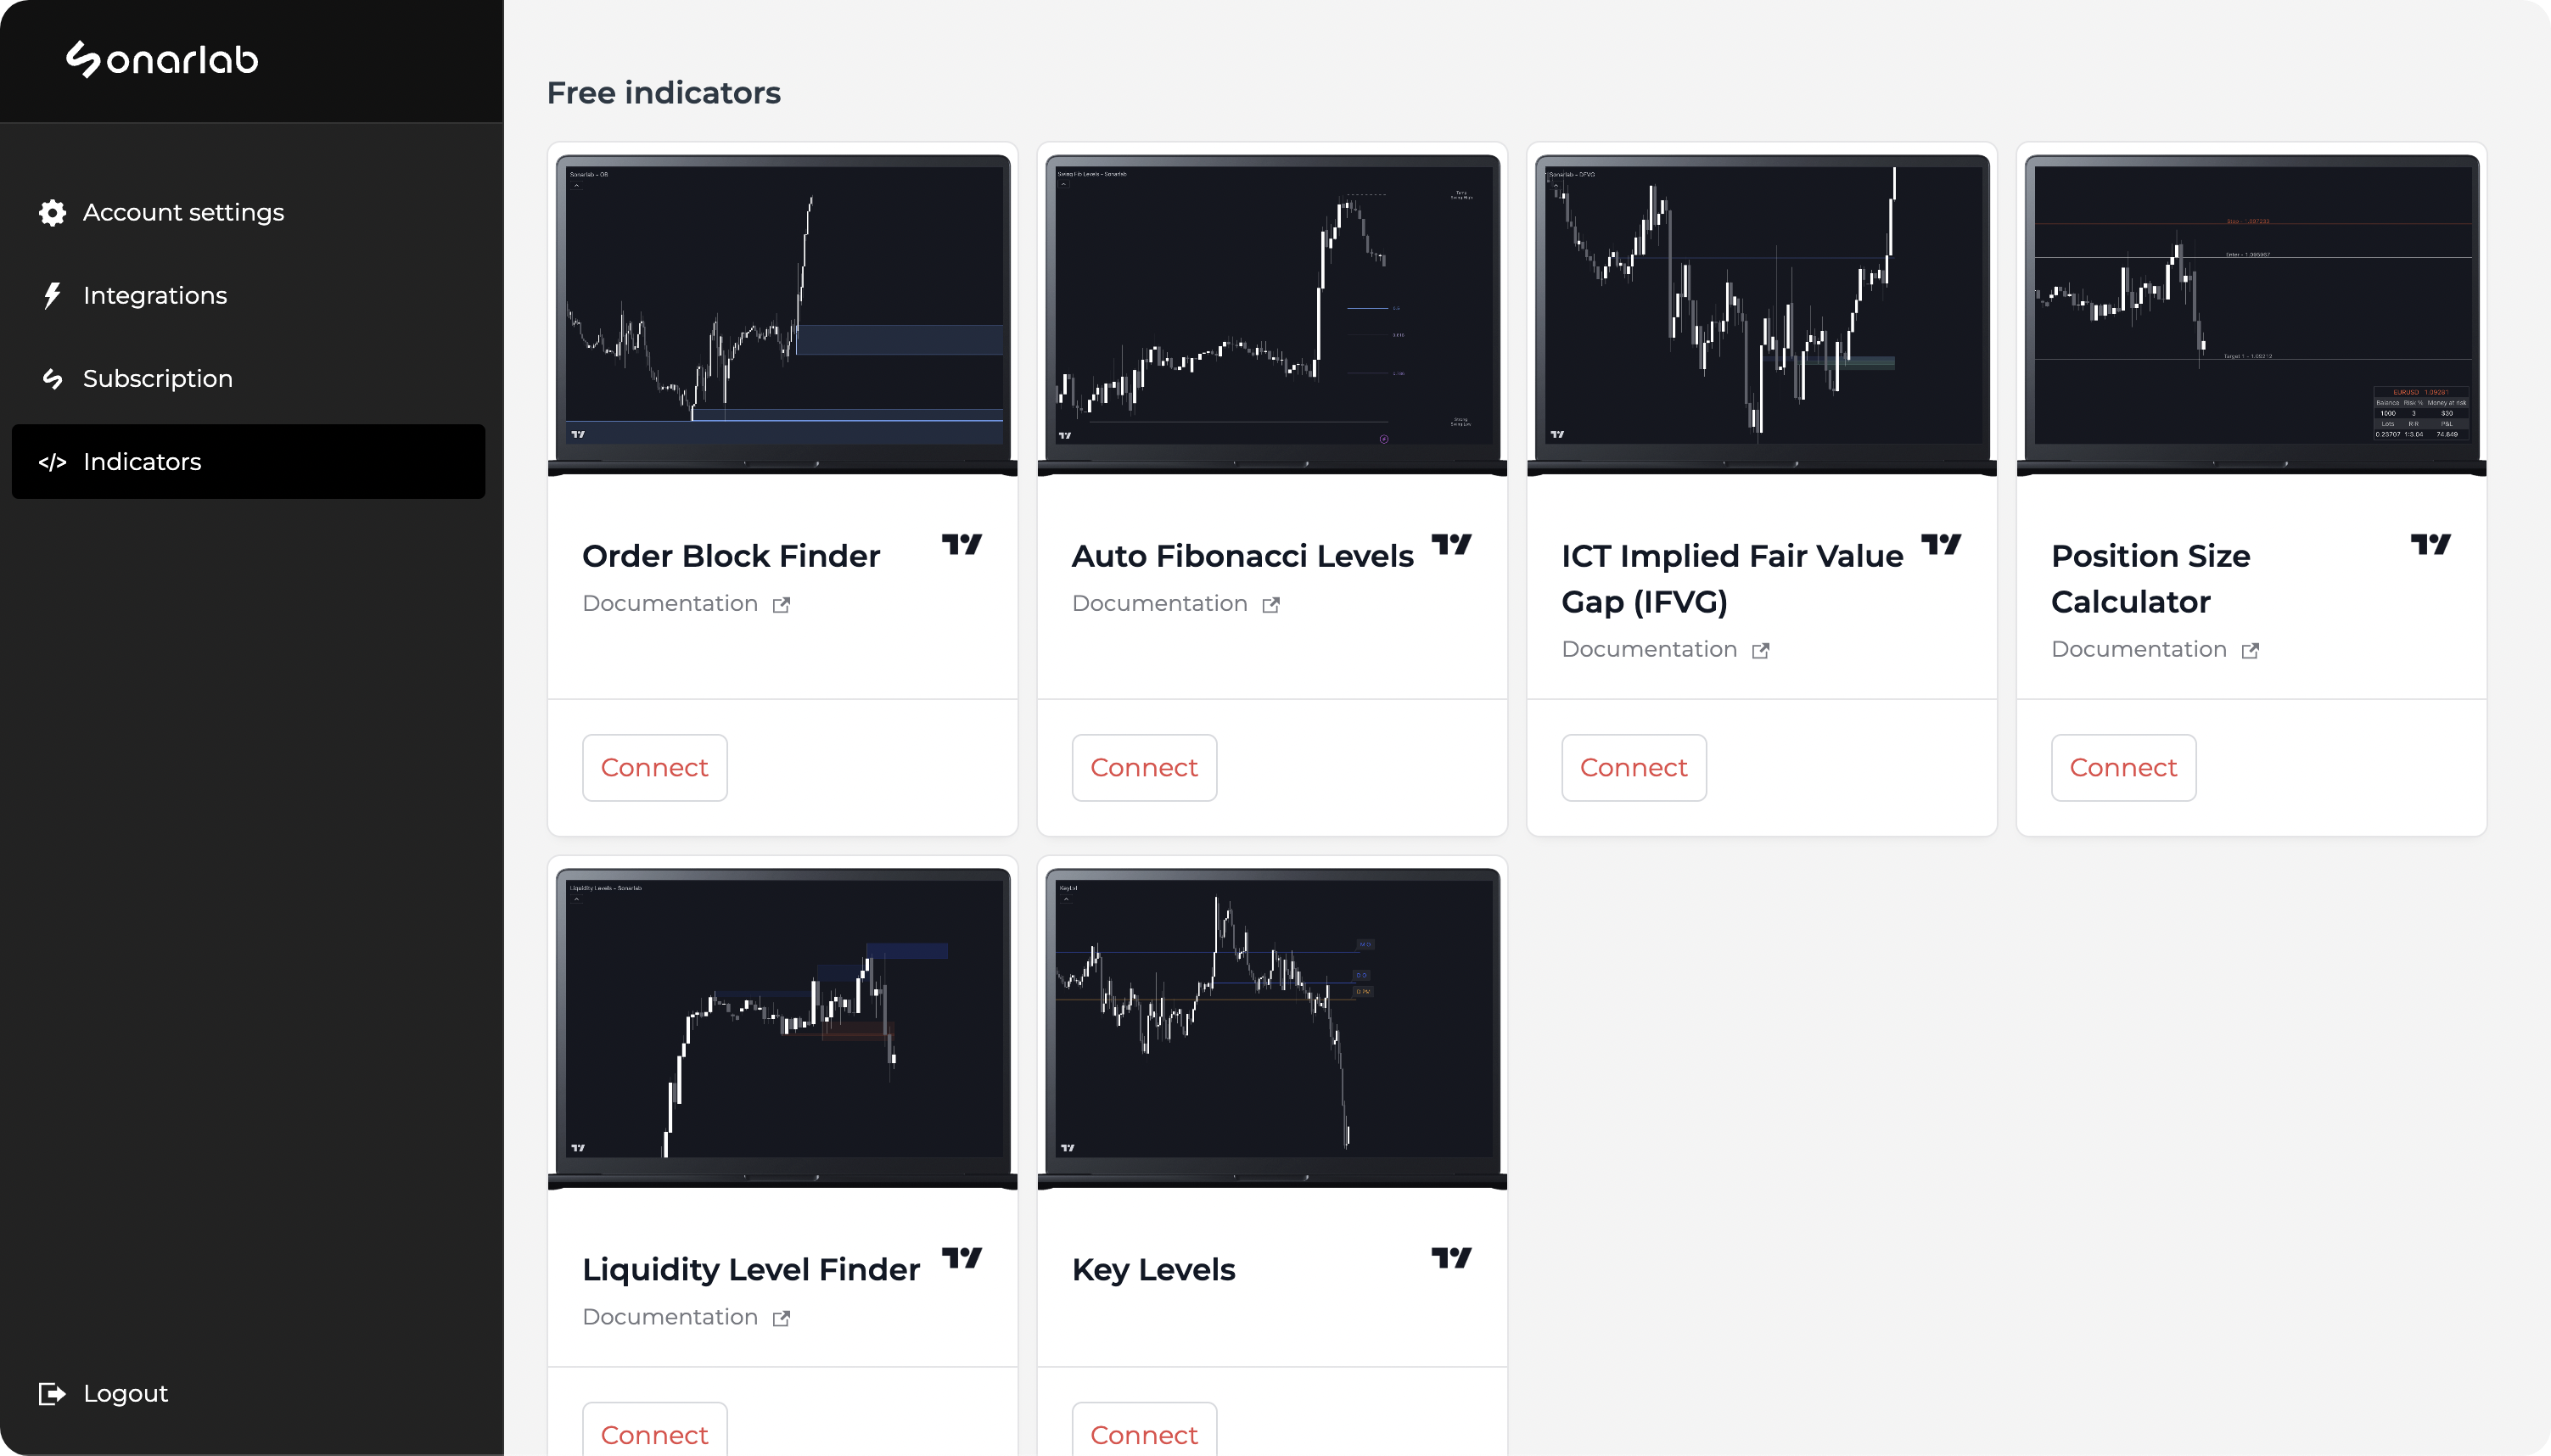
1. Login Sonarlab Dashboard
Login to your account or create a new account. Once you are logged in, locate the Indicator tab on the left.
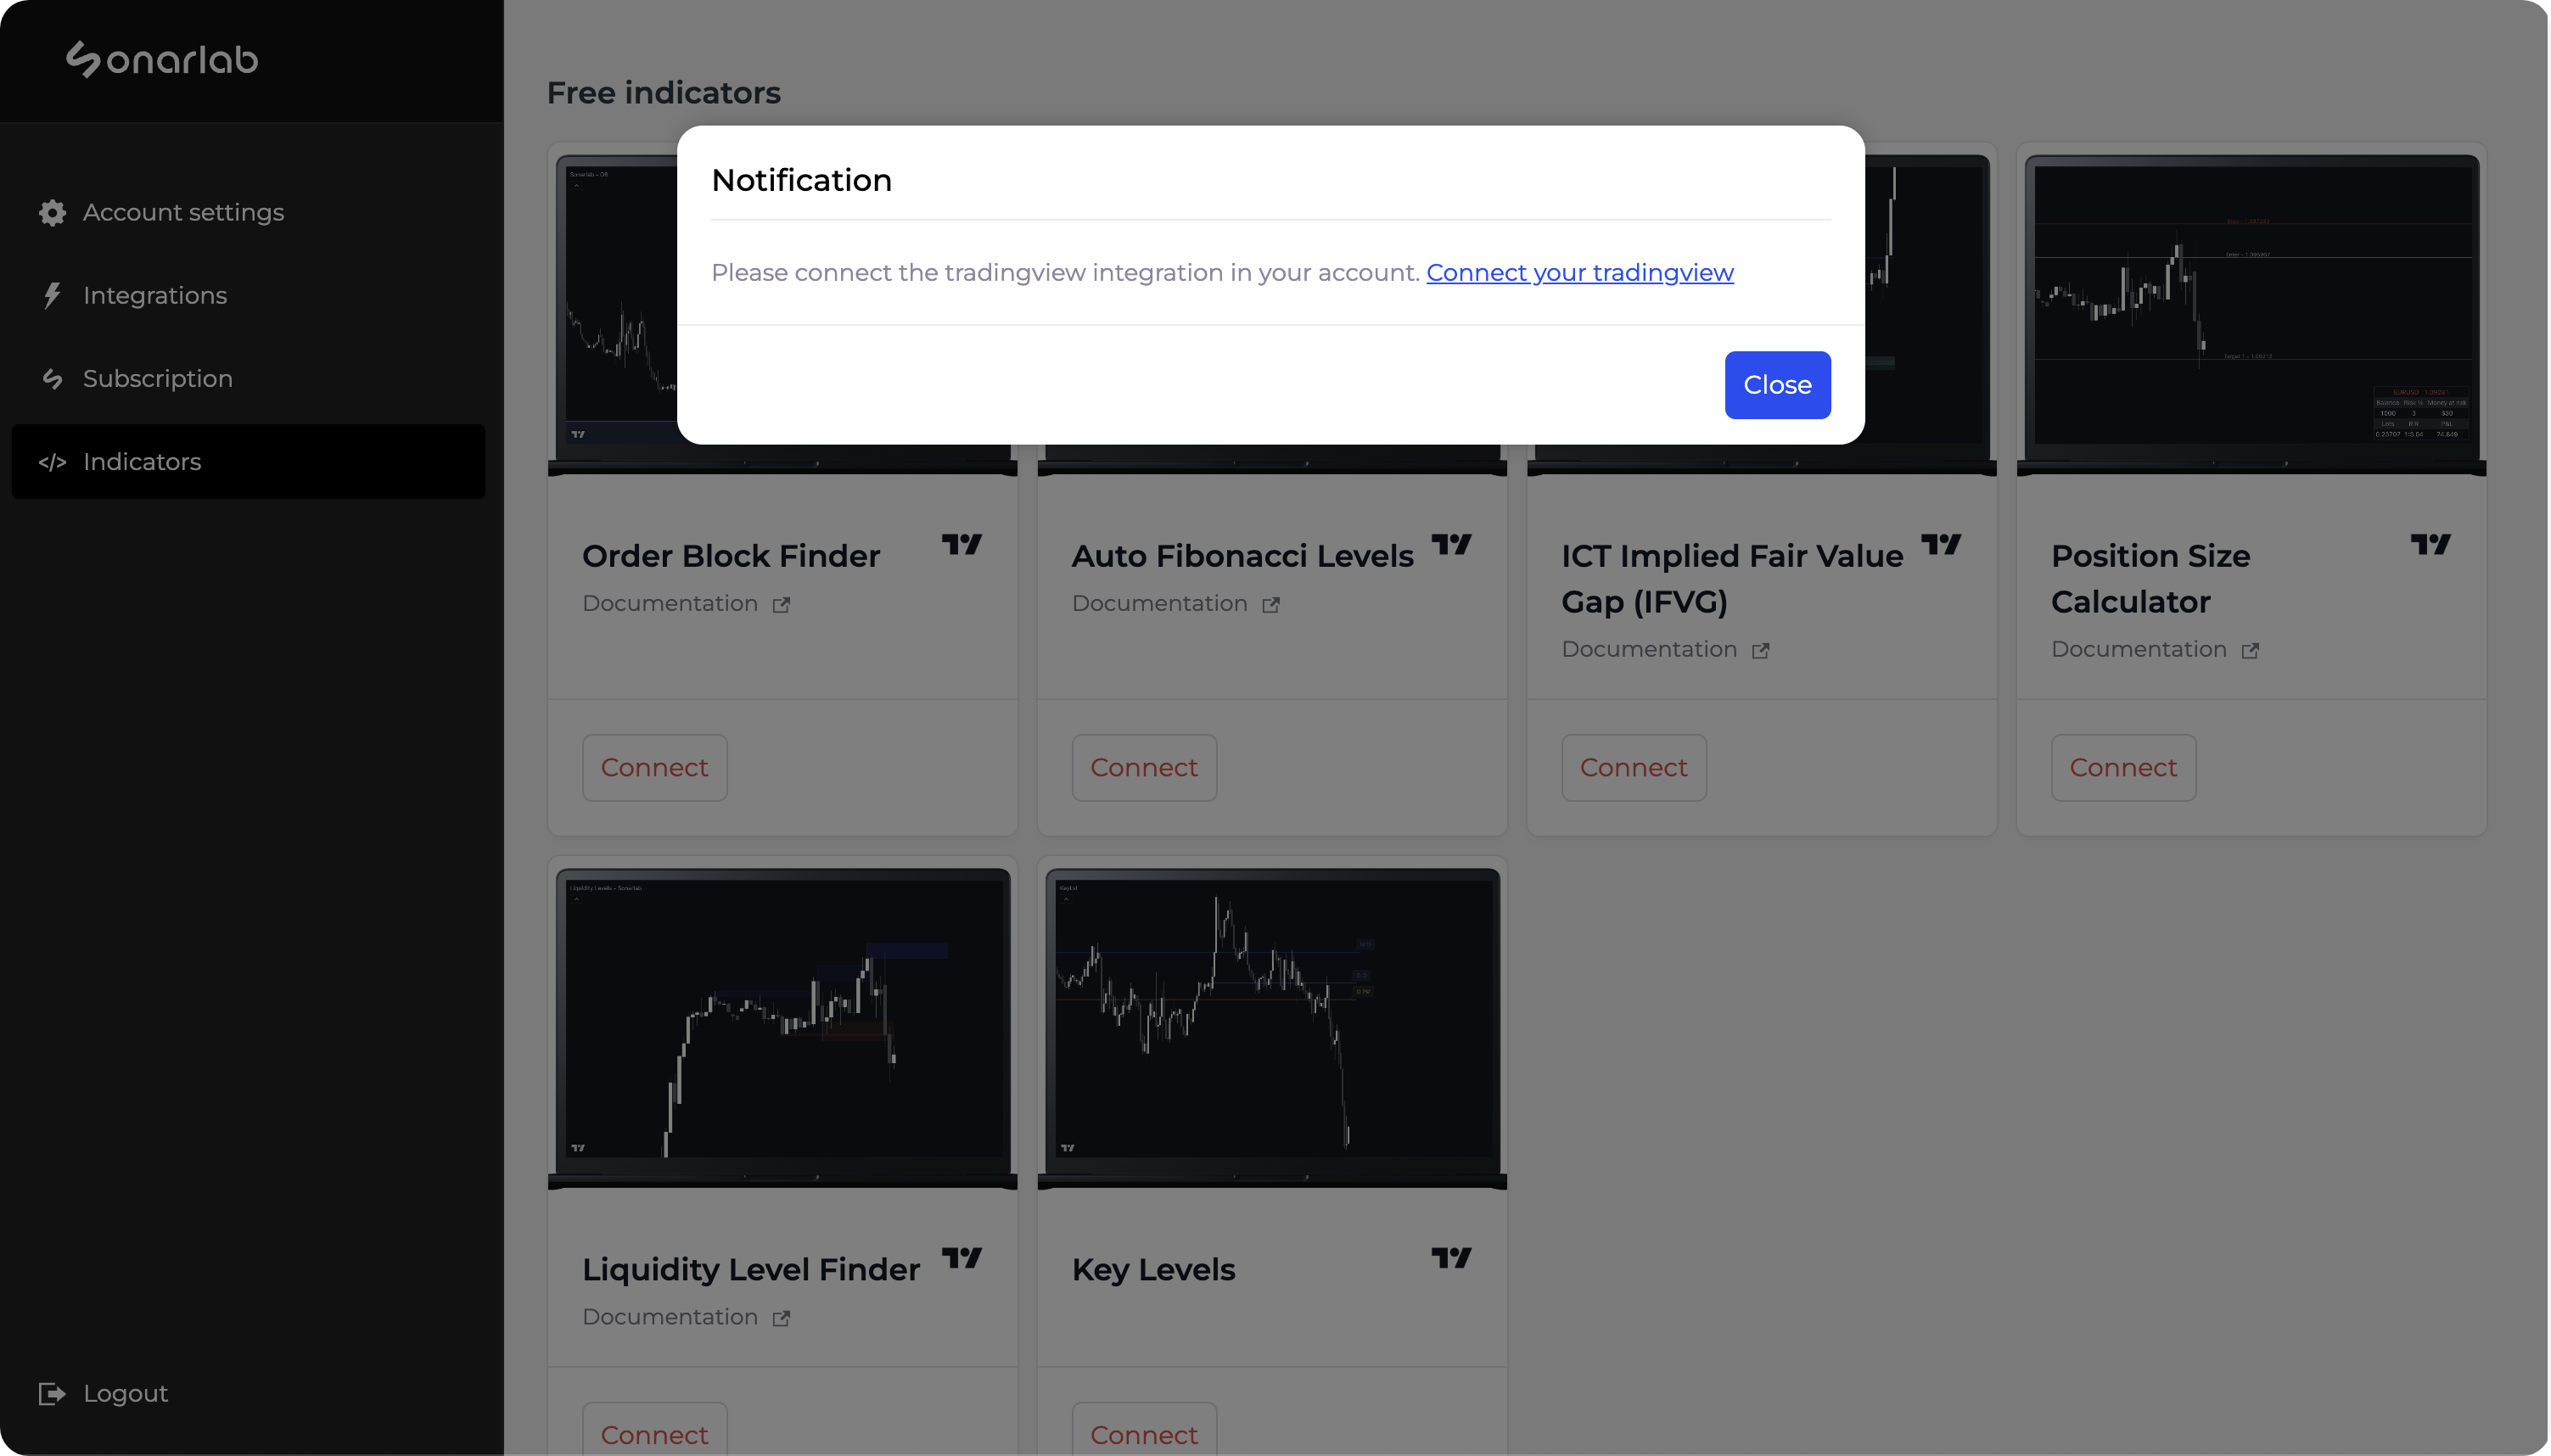
2. Connect account
If you did not connect your account already, you will receive this pop-up: "please connect the TradingView integration in your account. Connect your TradingView." Make sure to click on: "connect your TradingView" and fill in your username.

3. Connect Script
Once this is done, click again on connect and you are done!
Loading the indicator in TradingView
1. Locate Indicator folder
In TradingView simply locate the Indicator folder and select the Invite-only scripts folder. In here you will see the script - if not, please refresh or close your TradingView.