


.svg)


Go back
Free Liquidity Finder Guide
August 6, 2023
This indicator uses Pivot Points to identify Liquidity Levels in the market. Liquidity Levels are levels in the market where you would expect price to be pulled towards. Liquidity Levels by Sonarlab also has an option to show Higher Timeframe Liquidity Levels.
Setting up Free Order Block Indicator
Once you have loaded the indicator on the chart, you will see the following things:

The color-coded lines in your trading setup refer to key liquidity levels associated with swing highs and swing lows in the market.
Red Lines (Swing Low Liquidity Levels)
These lines denote the areas of 'swing lows,' which are the points in a price chart where the price dips and then reverses direction. They typically mark an area of increased buying pressure, often coinciding with a strong demand zone. These zones are characterized by high liquidity as more traders are willing to buy at these levels, considering them as potential bargain points. When the price approaches a red line, it could be an indicator to expect a potential price bounce or reversal upwards.
Blue Lines (Swing High Liquidity Levels)
On the other hand, the blue lines represent areas of 'swing highs.' These are the points where the price peaks before reversing direction, indicating an area of high selling pressure, often aligning with a strong supply zone. These zones are characterized by high liquidity as traders are willing to sell at these levels, foreseeing a potential price drop. When the price approaches a blue line, it can signal a potential turning point where the price might start to decline.
These liquidity levels marked by red and blue lines can be particularly useful when planning trading strategies. Traders can utilize these levels as potential targets for their trades. For example, one might aim to buy near a red line (swing low) and sell near a blue line (swing high), capitalizing on the expected price movements between these levels.
Settings and parameters
Liquidity Mitigation Options
The Indicator has options for you to choose what happens to the Liquidity line/boxes once it has been mitigated. Either Keep them on the chart, or remove them.
Display Styles
Choose how the levels are displayed, either with Lines or Boxes.Set the your Extension options, by keeping the lines/boxes "short" or extend to current price, or maximum to the right
Colors and Styles
Set colors and styles for all lines and boxes
Alerts
The Liquidity Finder comes with 4 alerts: New High/Low printed, New HTF High/ Low, which are easy to set up. You can read the documentation here.
How to enable the Free Indicator?
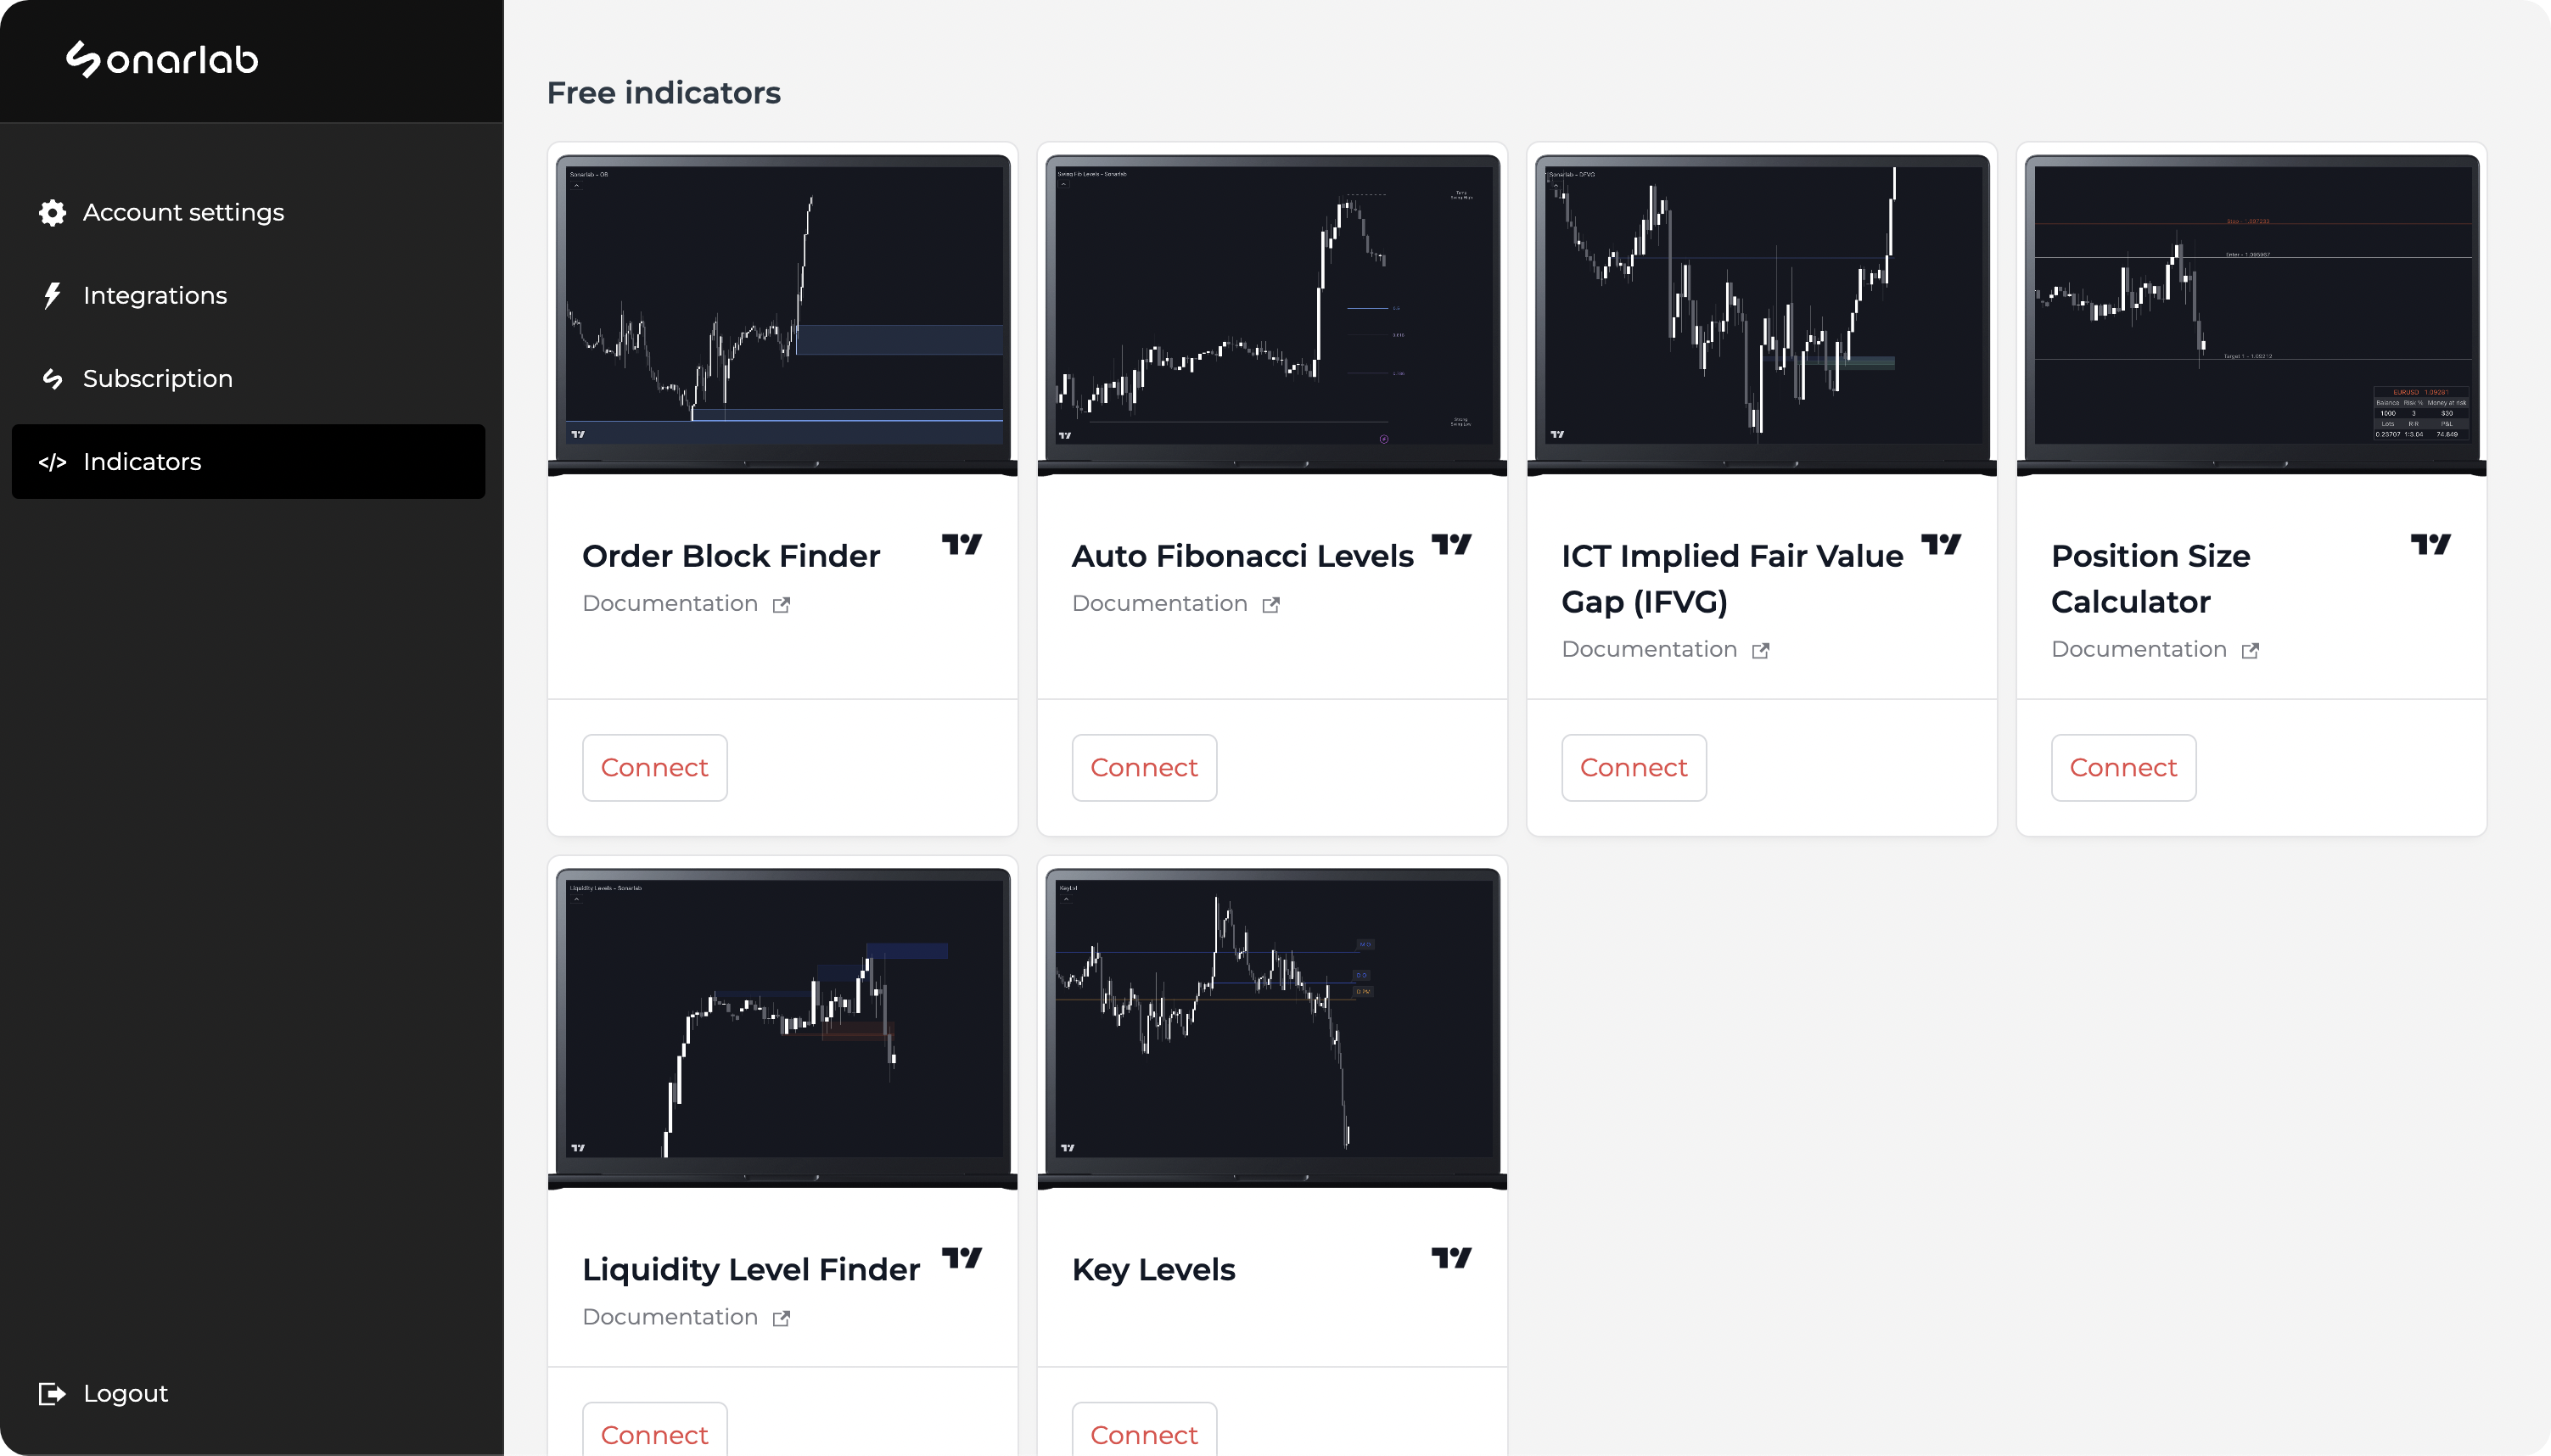
1. Login Sonarlab Dashboard
Login to your account or create a new account. Once you are logged in, locate the Indicator tab on the left.
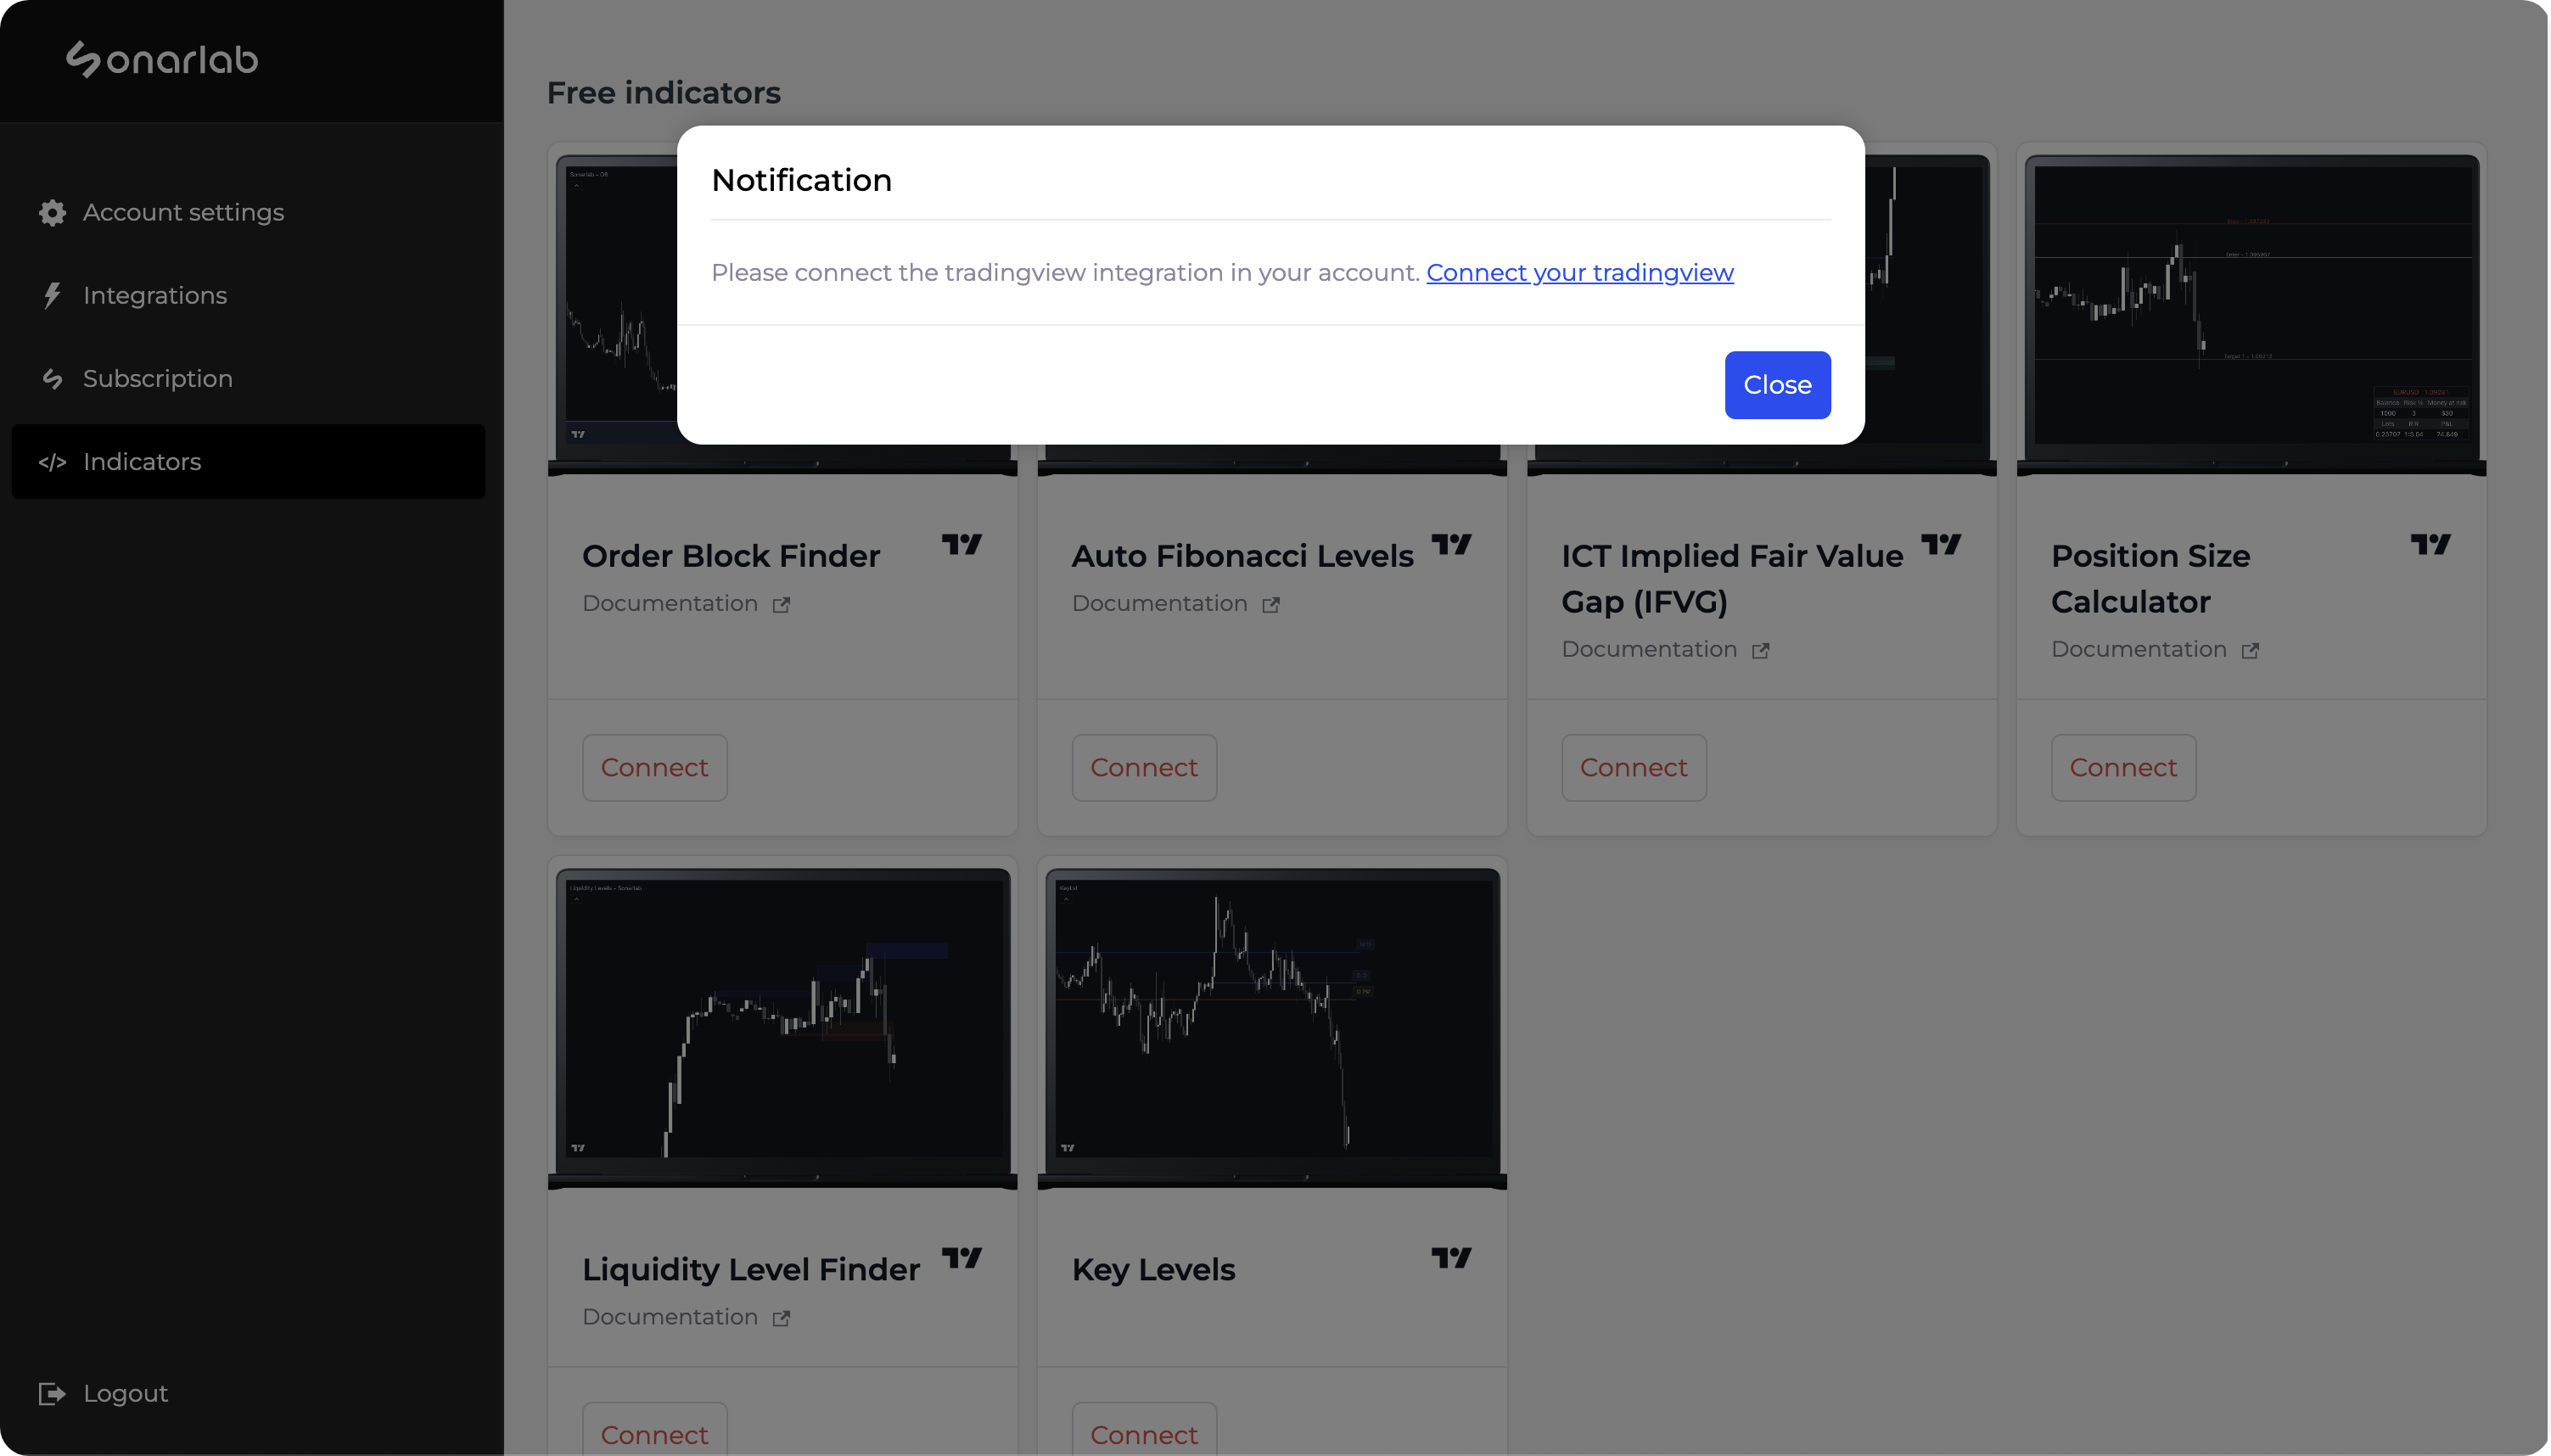
2. Connect account
If you did not connect your account already, you will receive this pop-up: "please connect the TradingView integration in your account. Connect your TradingView." Make sure to click on: "connect your TradingView" and fill in your username.

3. Connect Script
Once this is done, click again on connect and you are done!
Loading the indicator in TradingView
1. Locate Indicator folder
In TradingView simply locate the Indicator folder and select the Invite-only scripts folder. In here you will see the script - if not, please refresh or close your TradingView.