SMC Indicator
Smart Money Concepts Guide


Think of swing structures as a house, and internal structures as the stuff inside the house. Just like the furniture lives inside the house, the internal structure lives inside the swing structure. And if you consider price as something that can be broken down into smaller bits (like a fractal), then the internal structure is just the swing structure seen at a smaller scale or time.

Think of swing structures as a house, and internal structures as the stuff inside the house. Just like the furniture lives inside the house, the internal structure lives inside the swing structure. And if you consider price as something that can be broken down into smaller bits (like a fractal), then the internal structure is just the swing structure seen at a smaller scale or time.
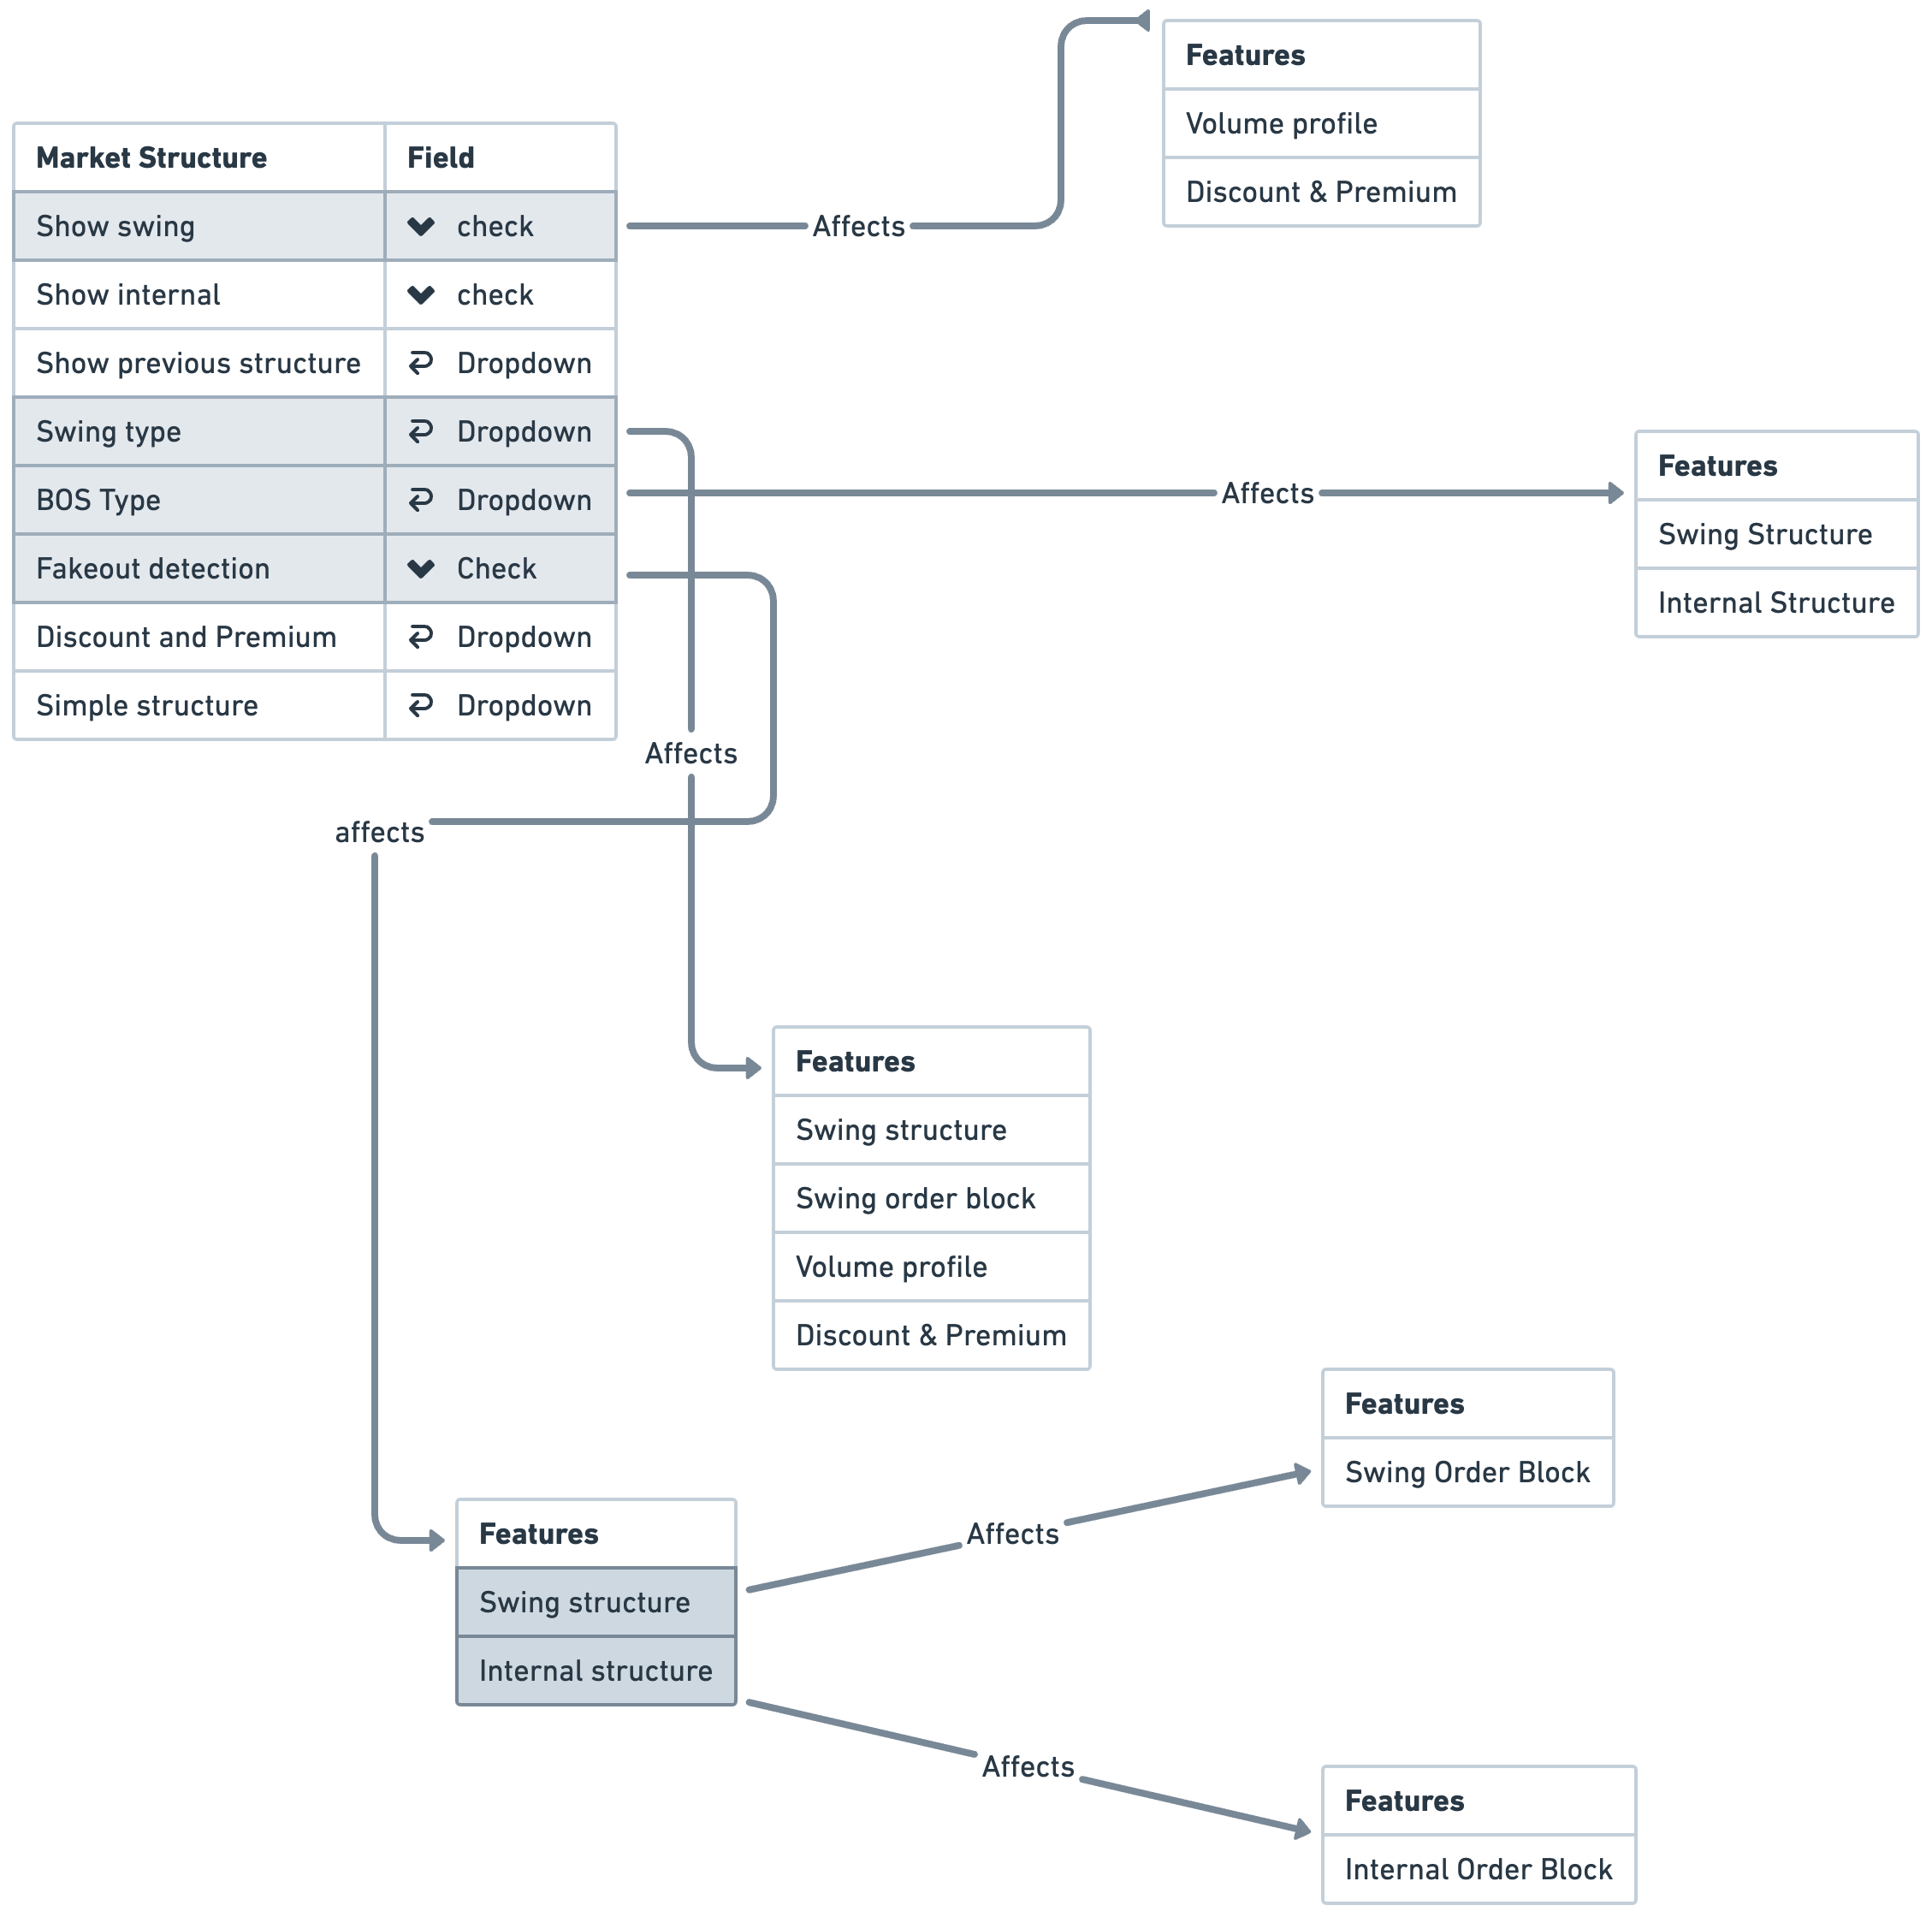
The swing and internal structure features plays a fundamental role in multiple features. Altering the swing and internal settings impacts various elements, including the volume profile, discount and premium levels, and the swing and internal order block feature. We included a diagram which visualize what setting impacts which element.
If you want to see historical swing or internal highs, lows and breaks you can click on the dropdown and select "swing/ Internal or all".
There are two types of swing types inside the SMC Indicator. 1. Adaptive and 2. Natural. Both with a totally different approach. Where adaptive will show you much smaller ranges, the Natural swing will show you much broader swing ranges. This depends on what you prefer - play around with it.
This feature will set the rule of the break of the structure. If you want to have it on close the candle needs to close below or above the low or high. See below an example where the wick counts as a valid break. This ended up in a liquidity grab. You can use this feature to spot liquidity grabs by setting alerts.
The indicator we use distinguishes between two types of Order Blocks: Swing and Internal. Here's how they differ: When there's a market structure break accompanied by sufficient volume, it results in an order block. If the break occurs within a larger swing in the market, we refer to it as a Swing Order Block. Conversely, if the break is smaller and happens within the broader market structure, we call it an Internal Order Block.

This setting controls the number of order blocks the indicator will plot on your chart. However, bear in mind that the number you set corresponds to pairs of order blocks. For instance, if you set it to 1, the indicator will display one bullish Order Block and one bearish Order Block.
There are three types of Order Block Styles, you can only enable 1 at the time.
OB Zone:
This setting is on, on default and it is the traditional style of plotting the order blocks.
Breaker Blocks:
This setting will plot breaker blocks on your chart.
OB Profile:
This is a different style for the traditional style, it only plots it different on your chart and alligns the order blocks on the right.
This will allow you to set the rule of when the order block should be counted as mitigated. It gives you the option to choose from: first touch/ 50% wick/ wick and close.
An other confluence we can add to our trades are imbalance. Some say that an order block needs to leave an imbalance in order to make the order block valid. This depends on your rules, but you can for sure add this to your list. An imbalance is created when the order block creates such impulsive volume in the market that it throws off the equilibrium between buyers and sellers, forming a gap. This is referred to as imbalance or FVG. These gaps act as a magnet for price to retrace to, in order to correct the disturbance in market equilibrium. So we got different type of Imbalances/ FVGs, you can navigate bellow to learn more.

This feature allows you to enable the Imbalances/ FVGs on a higher timeframe. Simply select the timeframe you want and it will plot it for you.
This setting lets you establish a minimum size limit for imbalances. A setting of 0 will permit all imbalances, irrespective of their size, whereas a setting of 100 will filter out imbalances, even those of considerable size. This allows for flexibility based on your trading approach and desired level of risk.
Set the mitigation level for the FVG
Market liquidity is an overlooked topic when it comes to trading. The definition of liquidity is; “the availability of liquid assets to a market or company”. In the simplest way possible, Liquidity is a measure of the ease of ability to enter and exit a market at the desired price based on the number of buyers (bids) and sellers (asks/offers) in that market. Read more about liquidity here.

Set the mitigation level of the Buyside and Sellside liquidity
This setting controls the number of levels the indicator will plot on your chart. However, bear in mind that the number you set corresponds to pairs of liquidity levels. For instance, if you set it to 1, the indicator will display one Buyside Liquidity Level and one Sellside Liquidity Level.
Trendline liquidity shares a similar concept. Put simply, liquidity resides behind any noticeable level. Trendlines represent a neat alignment of highs or lows, fashioned into a line. There are multiple highs that need to be surpassed. The more clear-cut the trendline, the larger the liquidity pool.

The 'Focus Mode' function allows you to zero in on the most recent price action. As its name suggests, this feature provides a concentrated view of recent market movements, enabling you to concentrate on the immediate price changes without the distraction of older data. This can be particularly beneficial when you want to analyze short-term market trends or make quick trading decisions.
The color theme gives you the option to choose between: dark and light mode
This will show you the trend color based on internal market structure.
The term 'equal highs and lows' is self-explanatory. It refers to a clearly defined support or resistance boundary that traders anticipate will be respected. However, it often happens that this expectation is disrupted, and the level is eventually breached.

The 'Focus Mode' function allows you to zero in on the most recent price action. As its name suggests, this feature provides a concentrated view of recent market movements, enabling you to concentrate on the immediate price changes without the distraction of older data. This can be particularly beneficial when you want to analyze short-term market trends or make quick trading decisions.
The color theme gives you the option to choose between: dark and light mode
This will show you the trend color based on internal market structure.
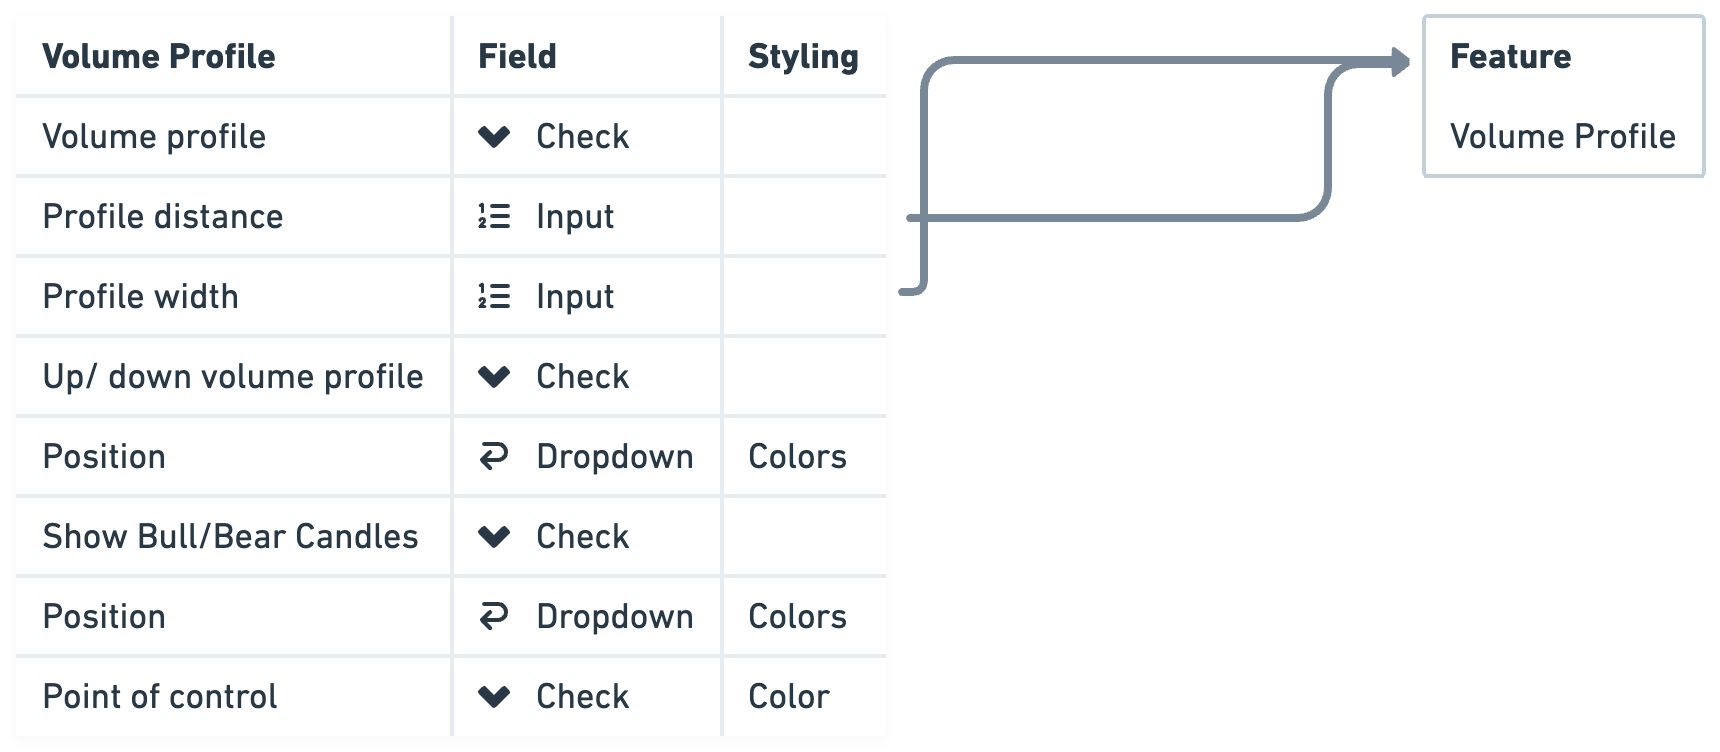
In SMC trading, we often focus on trading within ranges. To understand where most of the trading volume lies within these ranges, we use a tool called the Sonarlab SMC Volume Profile. This tool automatically displays the volume profile for the current range the market is trading in. It gives us crucial insights about trading activity in that range.

The 'Focus Mode' function allows you to zero in on the most recent price action. As its name suggests, this feature provides a concentrated view of recent market movements, enabling you to concentrate on the immediate price changes without the distraction of older data. This can be particularly beneficial when you want to analyze short-term market trends or make quick trading decisions.
The color theme gives you the option to choose between: dark and light mode
This will show you the trend color based on internal market structure.